Tips and tricks for ggplot2
Avoiding (re-)Googling tricks for perfecting graphics
By Andrea Rau in Tips and tricks
January 31, 2019
Like many (most?) users of the ggplot2 visualization package, I often find myself (re-)looking up how to do specific tasks. In an effort to streamline by Googling and avoid searching over and over again for solutions to the same issues, this post will gather together some of the assorted tips and tricks that I’ve recently looked up.
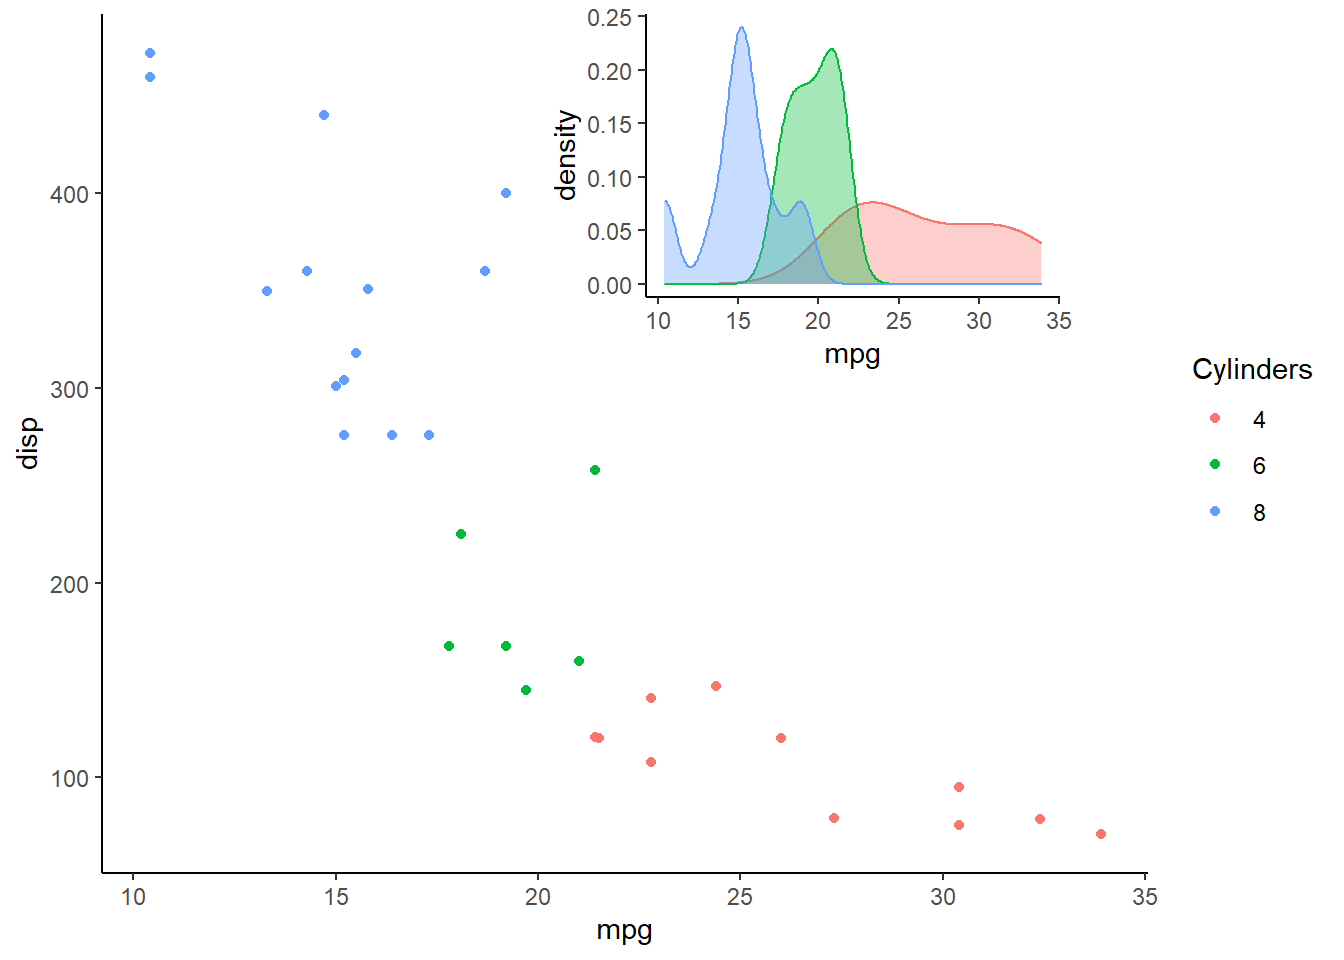
Including an inset graph
I found this tip
here, using the cowplot package. The x, y, width, and height parameters in the draw_plot function can be used to adjust the position and size of the inset graph.
library(ggplot2)
library(cowplot)
data(mtcars)
main_plot <- ggplot(mtcars) +
  geom_point(aes(x=mpg, y=disp, color=factor(cyl))) +
  scale_color_discrete(name = "Cylinders") +
  theme_classic()
inset_plot <- ggplot(mtcars) +
  geom_density(aes(x=mpg, fill=factor(cyl), color=factor(cyl)),
               alpha = 0.35) +
  guides(fill=FALSE, color=FALSE) +
  theme_classic()
plot_with_inset <-
  ggdraw() +
  draw_plot(main_plot) +
  draw_plot(inset_plot, x = 0.4, y = 0.6, width = 0.4, height = 0.4)
plot_with_inset